
Principal Investigator
Prof Derek H. Arnold
School of Psychology
McEllwain Bld
The University of Queensland
St. Lucia, Qld, Australia, 4072
Email: d.arnold@psy.uq.edu.au
Precision Test for Metacognitive Sensitivity
People experience levels of confidence when they make decisions. They tend to feel more
confidence when they make good decisions. This degree of insight that people have, into
when they have made good or bad decisions is called metacognitive sensitivity.
Currently, the most popular way to estimate metacognitive sensitivity is based on a development
of the signal detection framework. This framework allows researchers to infer how sensitive
people are to the difference between two sensations. This framework has been extended,
to estimate how sensitive people are when distinguishing between their good and bad decisions,
guided by their feelings of confidence.
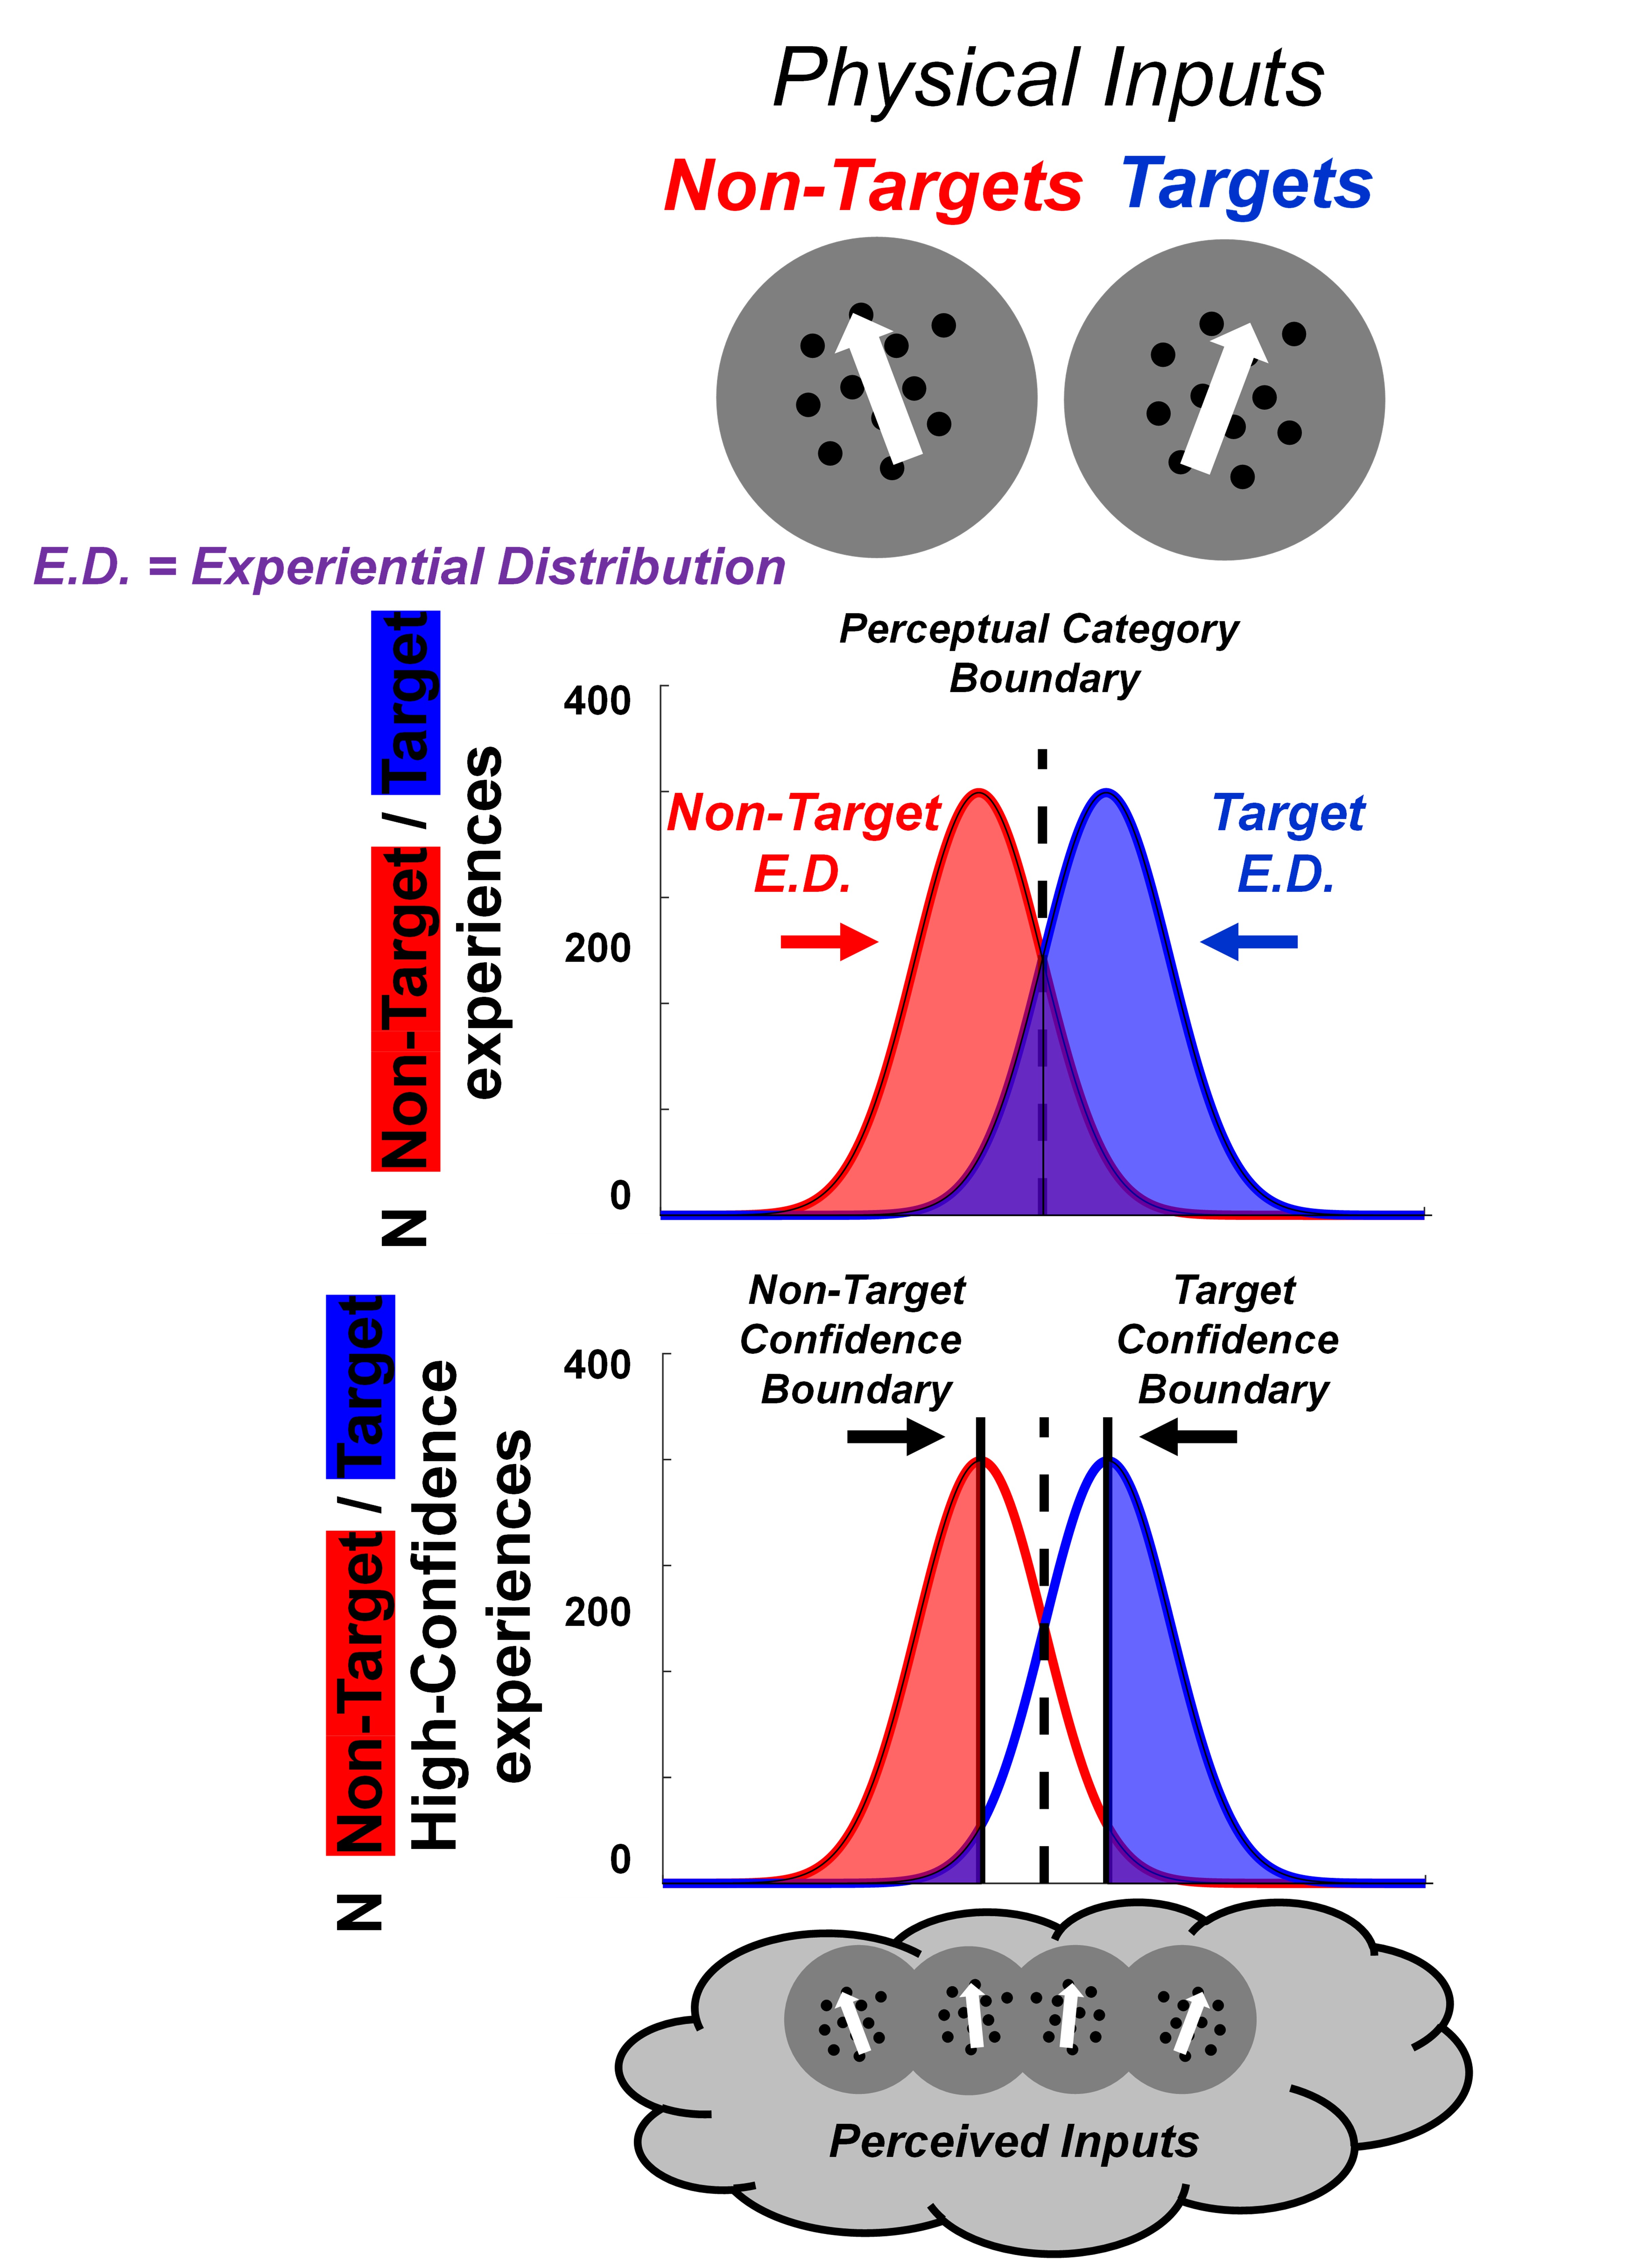
Graphic depicting the assumptions underlying popular extensions of the Signal Detection
framework, used to analyse confidence. Repeated exposures to a physical input are
understood to generate a range of different experiences. Repeated exposures to an
input containing movement drifting 10 degrees to the left of upward would, for instance,
mostly result in experiences of movement drifting 10 degrees to the left of upward, but
also in some experiences of directly upward movement, and in some experiences of
movement drifting even more to the left of upward. Perception is a bit noisy, so our
experiences are a little variable. We call the distributions of different experiences
following from repeated exposures to a common physical input experiential
distributions (EDs).
Standard implementations of Signal Detection Theory (SDT) are used to estimate
sensitivity to differences between two sensations (see top graphic). By assuming that
people require a magnitude of difference between a sensation and a different experience
(see bottom graphic) before they will be confident that they have indeed experienced the
former sensation, SDT-based analyses of confidence can estimate how well we can
distinguish between the sensation of making a good vs a bad decision.
SDT-based analyses of confidence were a great improvement on pre-existing methods. But
they have their own problems. Specifically, they must make an assumption about the shape
that describes experiential distributions. If a researcher is even slightly wrong about this
shape, they can under- or over-estimate a persons' metacognitive sensitivity.
You can download matlab scripts that demonstrate these issues through simulated experiments by clicking on the link below.
Download simulation archive
We have developed a more robust measure, which we call a precision test for metacognitive
sensitivity. We fit psychometric functions to data sampled from many more than just 2
test inputs (see the graphic below). We consider performance in experiments where a person
must categorise the experience they have had on each trial, and must also rate the level
of confidence they have in this decision. If the only thing separating relatively high- from
low-confidence decisions is a confidence criterion (a requisite magnitude of difference between
the sensation they have had on this trial, and the different experiences of the other category
of input), and if the criteria people use to rate their levels of confidence are as reliable as the
criteria they use to categorise perceptual experiences, then functions fit to data that describe
decisional confidence should be laterally shifted from a central function that describes
all perceptual decisions (see the top panel in the graphic below). This situation can be described
as metacognitively ideal, as the person's feelings of confidence would be fully informed by
the same information that has informed their perceptual decisions.
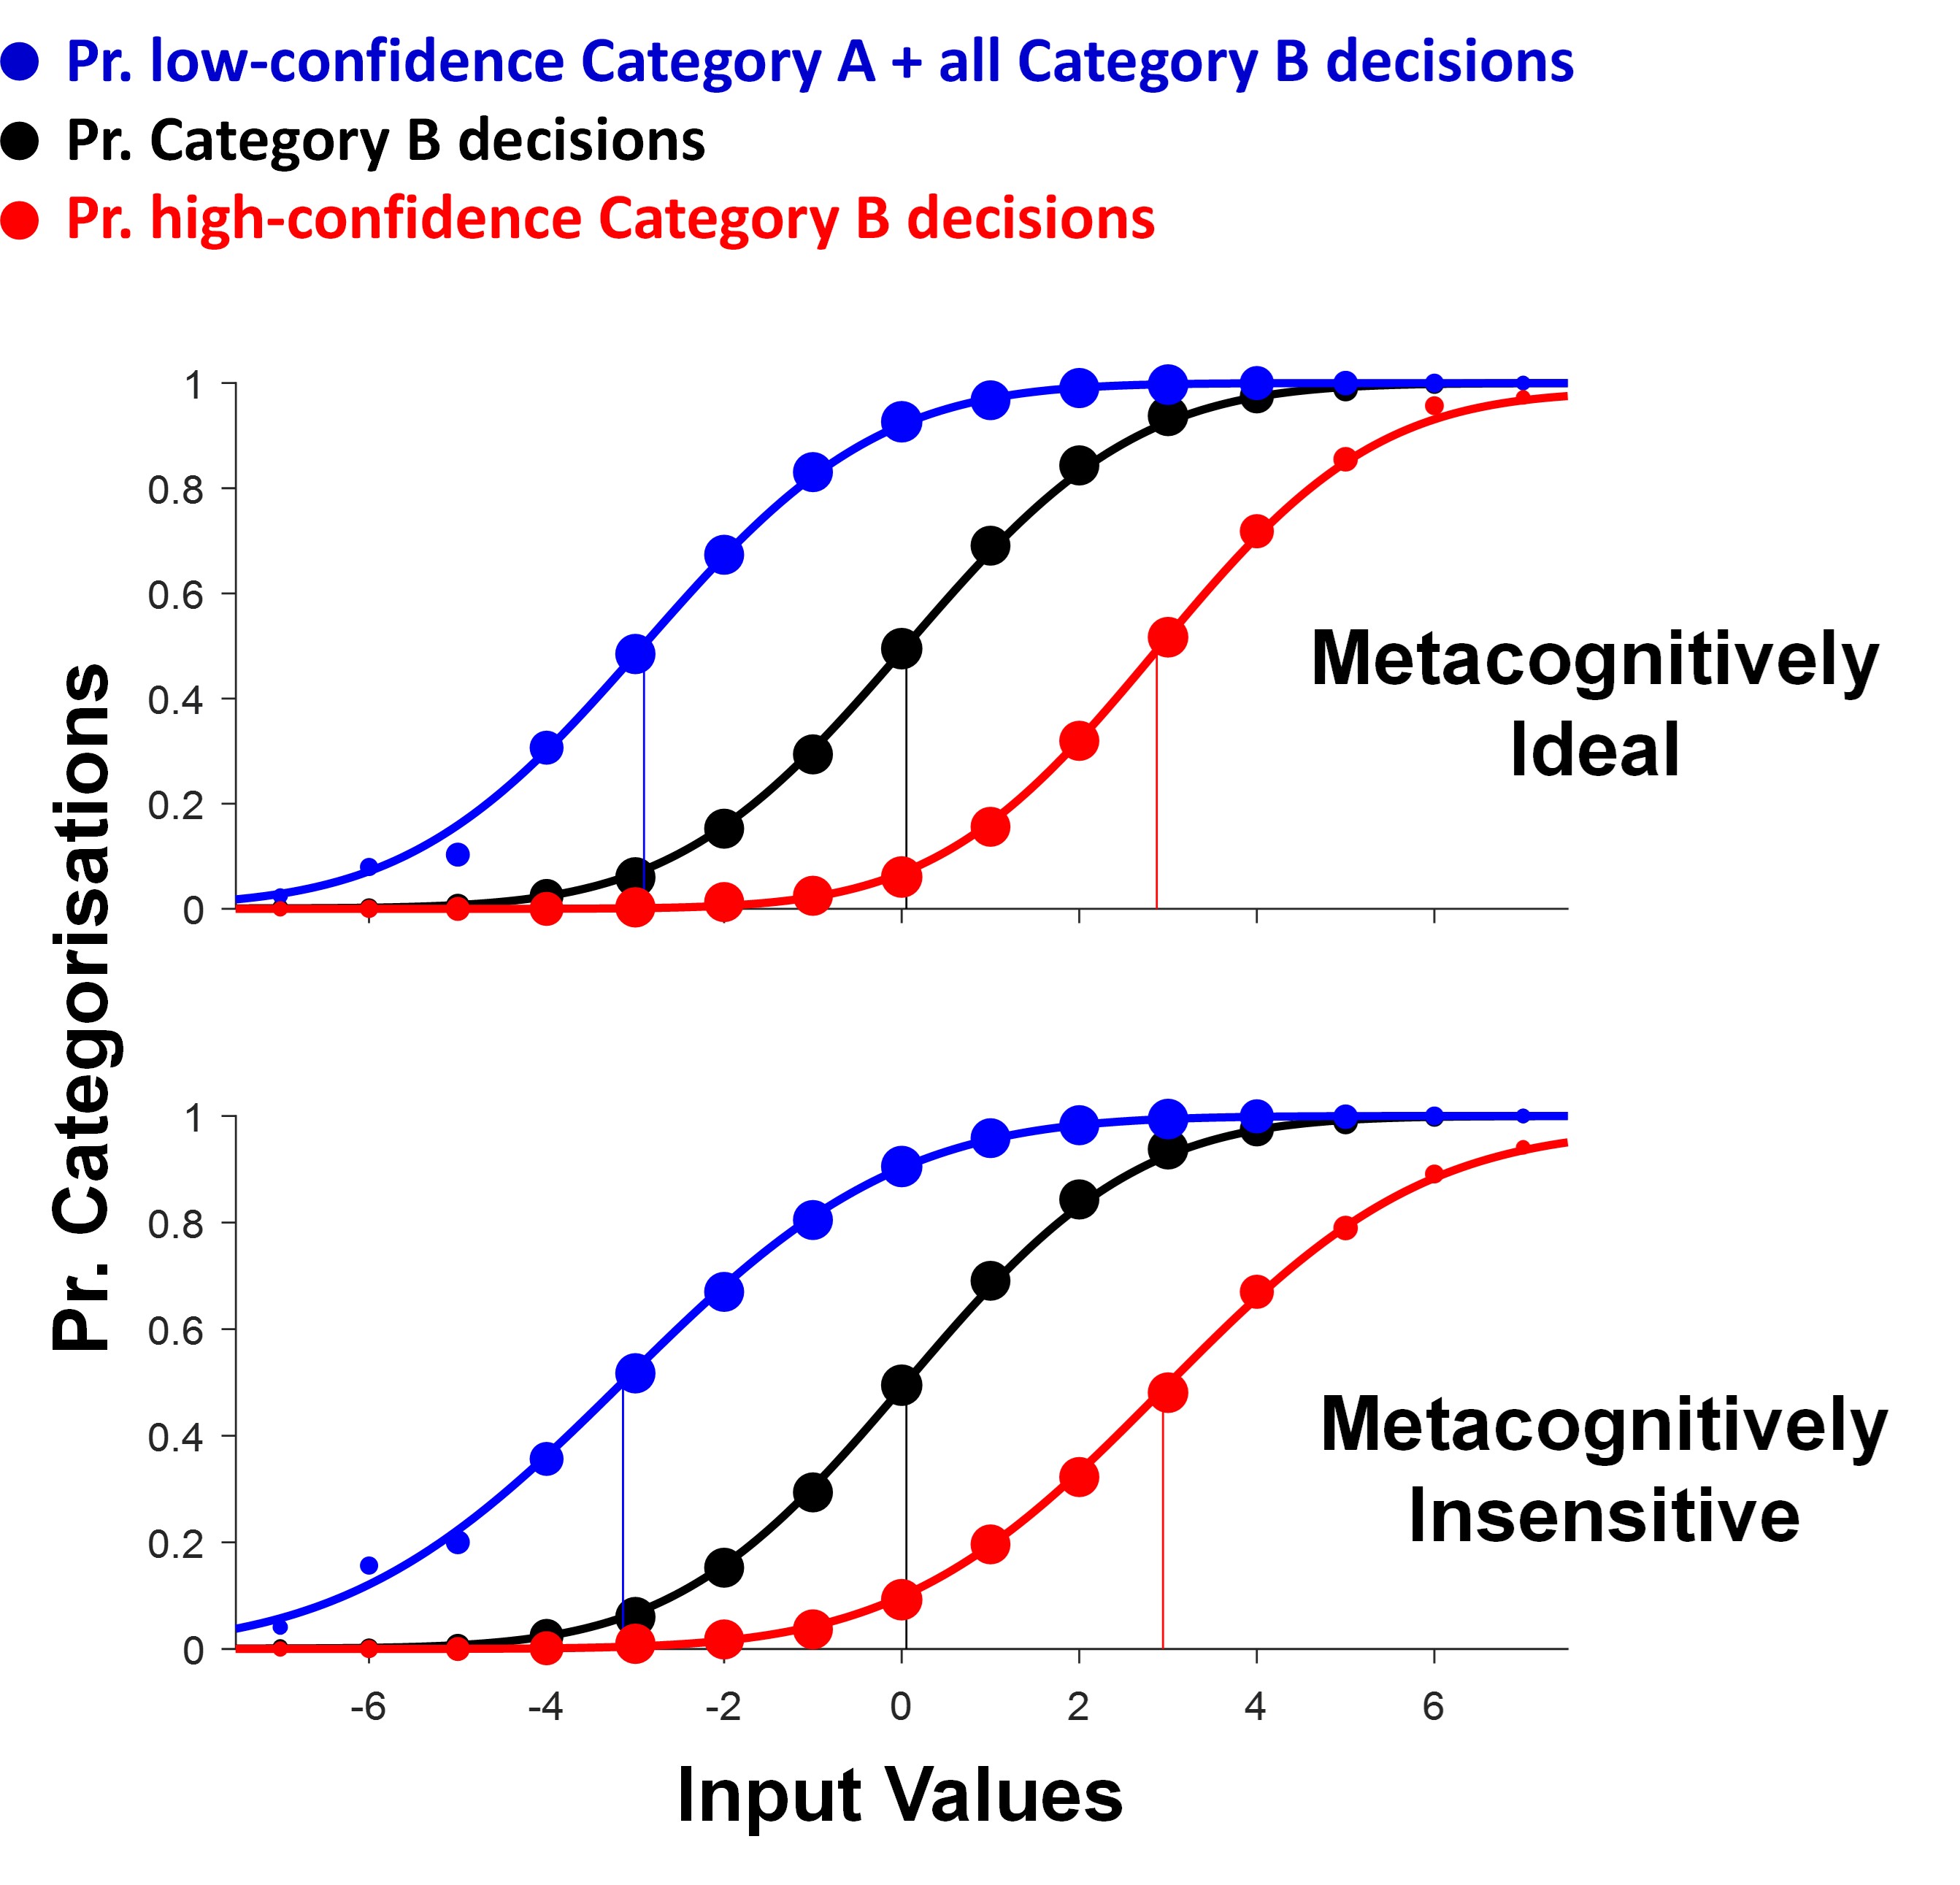
Alternatively, our feelings of confidence may be more variable across different trials than our
perceptual decisions, because they are informed by additional factors relative to our decisions,
or because the criteria we use to rate confidence are less stable than the criteria we use to
categorise perceptual inputs. In this case, the functions fit to data describing decisional confidence
will be shallower than the central function describing all perceptual decisions. In this
case, the person would be described as metacognitively insensitive, as their feelings of decisional
confidence are shaped by additional information relative to their perceptual decisions - so they
lack full insight into whether they have made a good or bad decision.
We have found that the standard deviations of fitted functions are a more robust test of metacognitive
sensitivity than other SDT-based analyses of confidence. There is a link to download an
archive containing matlab code that you can use to implement this test in an experiment below.
The achieve contains three matlab scripts.
meta_SETUP.m
Adaptive sampling routines for our test are set up by calling meta_SETUP.m
This script will 1) determine by how much test values will be adjusted in your experiment due to
participant responses, 2) create adaptive procedures that will target different sectors of psychometric
functions, 3) controls the length of your experiment, and 4) specify the first test value.
meta_UPDATE.m
After each trial, the experimenter calls meta_UPDATE.m
Before this script is called, the experimenter must define a variable set to the perceptual decision
recorded on that trial (Perceptual_Resp), and a second variable set to the confidence rating
(Confidence_Rating). The call to meta_UPDATE.m will store these responses in an array
Exp_Results, update the adaptive sampling routines, and specify the next test value.
meta_ANALYSE.m
When your experiment finishes, you should call meta_ANALYSE.m
This script will sort your experimental data into any conditions you have specified, and fit
cumulative Gaussian functions to, 1) The proportion of Low-Confidence Category A +
any Category B responses, as a function of tested values. We refer to this as the Category A
Confidence function (see blue data, bottom graphic). 2) The proportion of all Category B responses,
as a function of tested values. We refer to this as the Perception function (see black data,
bottom graphic). 3) The proportion of High-Confidence Category B responses, as a function of
tested values. We refer to this as the Category B Confidence function (see red data, bottom
graphic).
The scripts themselves contain more detailed instructions for their use, and the associated paper
contains a methods section that can be read as a tutorial, describing how an experimenter
can use the matlab scripts we provide to setup, control and analyse the results of an experiment
that measures metacognitive sensitivity and confidence bias.
Download archive