23 Result Visualisation
23.1 Develop visual representations of your results using R Markdown or other programming languages.
As researchers, our ultimate goal is to shed light on complex phenomena through the lens of data. And one of the most effective ways of presenting our findings is through visualisation. Visualisation translates the abstract world of numbers and statistics into tangible, comprehensible narratives, aiding both interpretation and communication of results. The advent of artificial intelligence has revolutionised this process, with tools like ChatGPT offering advanced support in data visualisation.
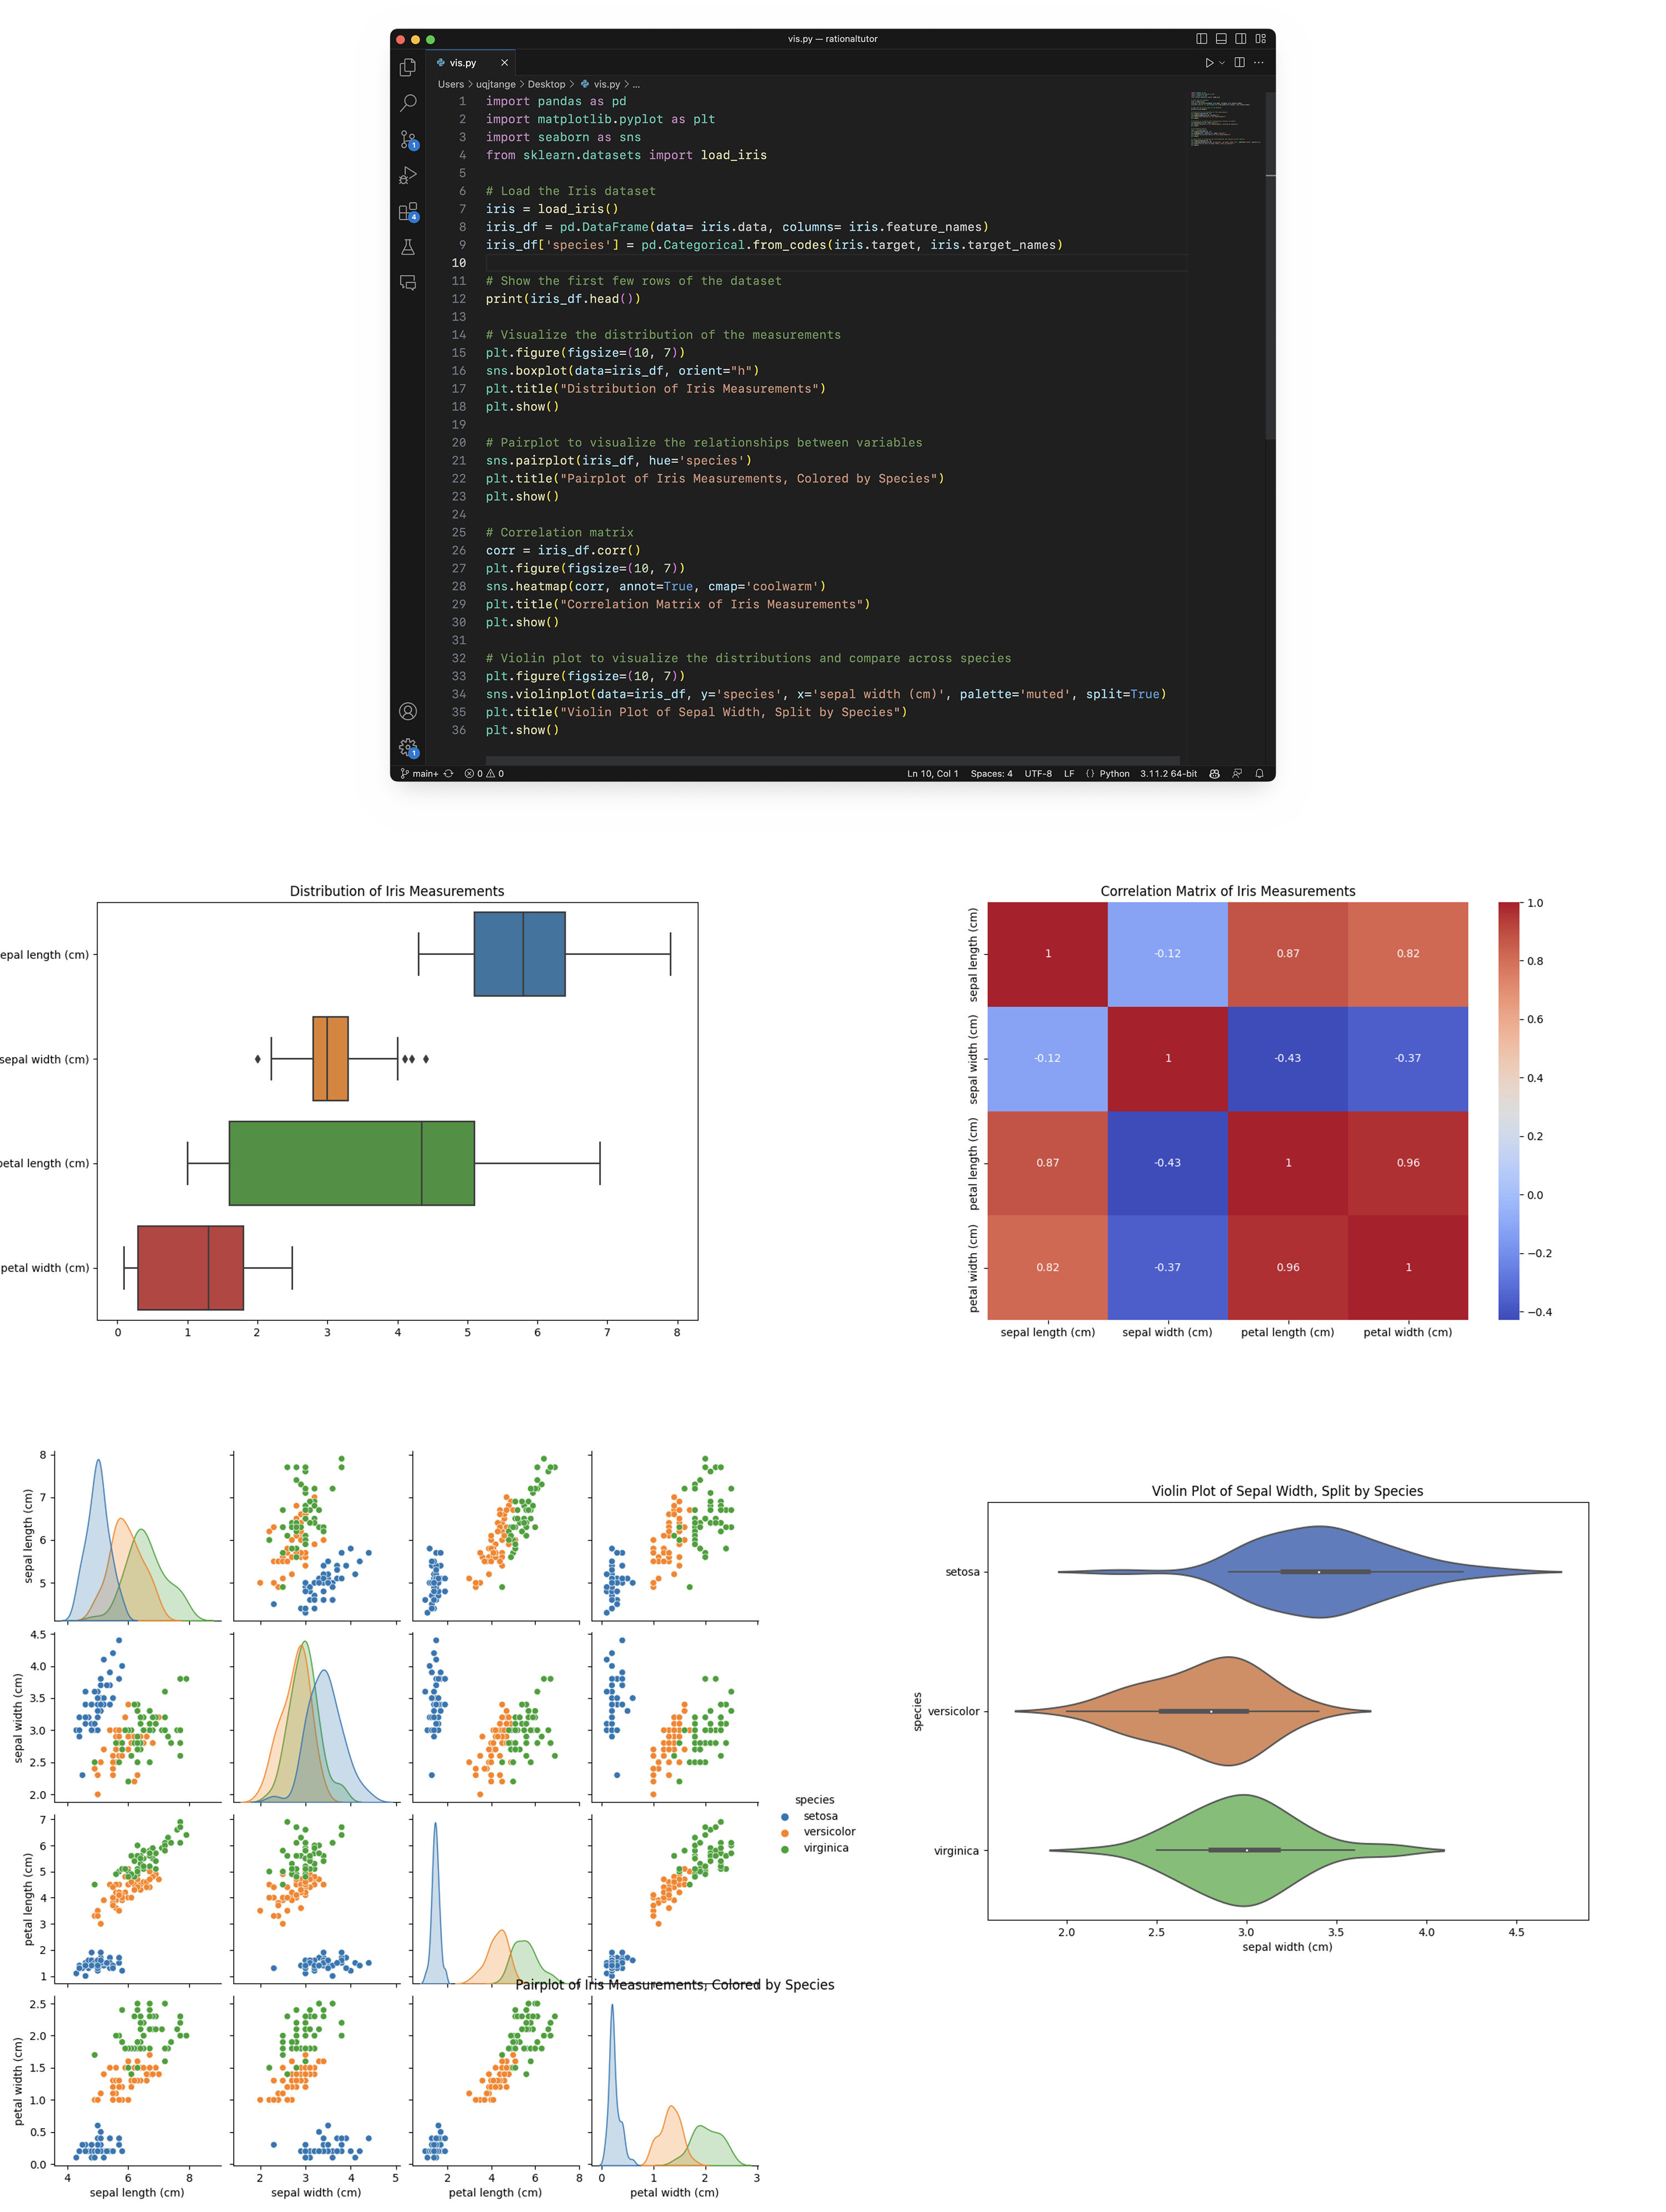
Boasting proficiency in popular programming languages such as R, Python, SQL, JavaScript, and others, ChatGPT can assist in creating a wide variety of visual representations for your data. From constructing simple bar graphs and scatter plots to designing intricate heat maps and interactive visuals, ChatGPT can cater to your specific visualisation needs. All you need to do is ask.
Importantly, however, ensure you clearly communicate what you’re looking for. If the initial output doesn’t meet your requirements, refine your instructions and ask again. For instance, you can provide examples of code that generates a similar visualisation to what you have in mind. The clearer your instructions, the more likely ChatGPT is to produce a visualisation that matches your vision.
Looking ahead, the introduction of GPT-4’s multimodal capabilities and its Code Interpreter feature promises to radically change how we interact with and visualise our data. With these features, you’ll be able to upload large data files, hundreds of megabytes in size, and ask GPT-4 questions about your data. You can even request GPT-4 to generate new insights from your data. Imagine being able to paste a picture of a desired visualisation style and asking GPT-4 to create something similar with your data! The possibilities for data exploration and presentation are set to expand dramatically.
The visualisation stage of your research is not just about presenting your data; it’s about telling a story. With tools like ChatGPT and the upcoming features of GPT-4, we are equipped with powerful narrators to help articulate our data’s tale. By leveraging these capabilities, we can ensure that our research not only reaches our audience but also engages, educates, and inspires them.
23.1.1 Prompt
I'm putting together a resource called Academic AI: A Collection of AI Tools and Prompts for Higher Education", and I'm writing a chapter on "Result Visualisation: Develop visual representations of your results using R Markdown or other programming languages." Write some complex and sophisticated code in Python that will really show off your data visualisation skills.